Education
Oklahoma’s non-teaching staffing surge
November 28, 2017
Benjamin Scafidi
Using categories defined by the National Center for Education Statistics at the U.S. Department of Education, all public school employees can be placed into one of two categories: (1) teachers, and (2) everybody else (hereafter called “non-teachers”).1
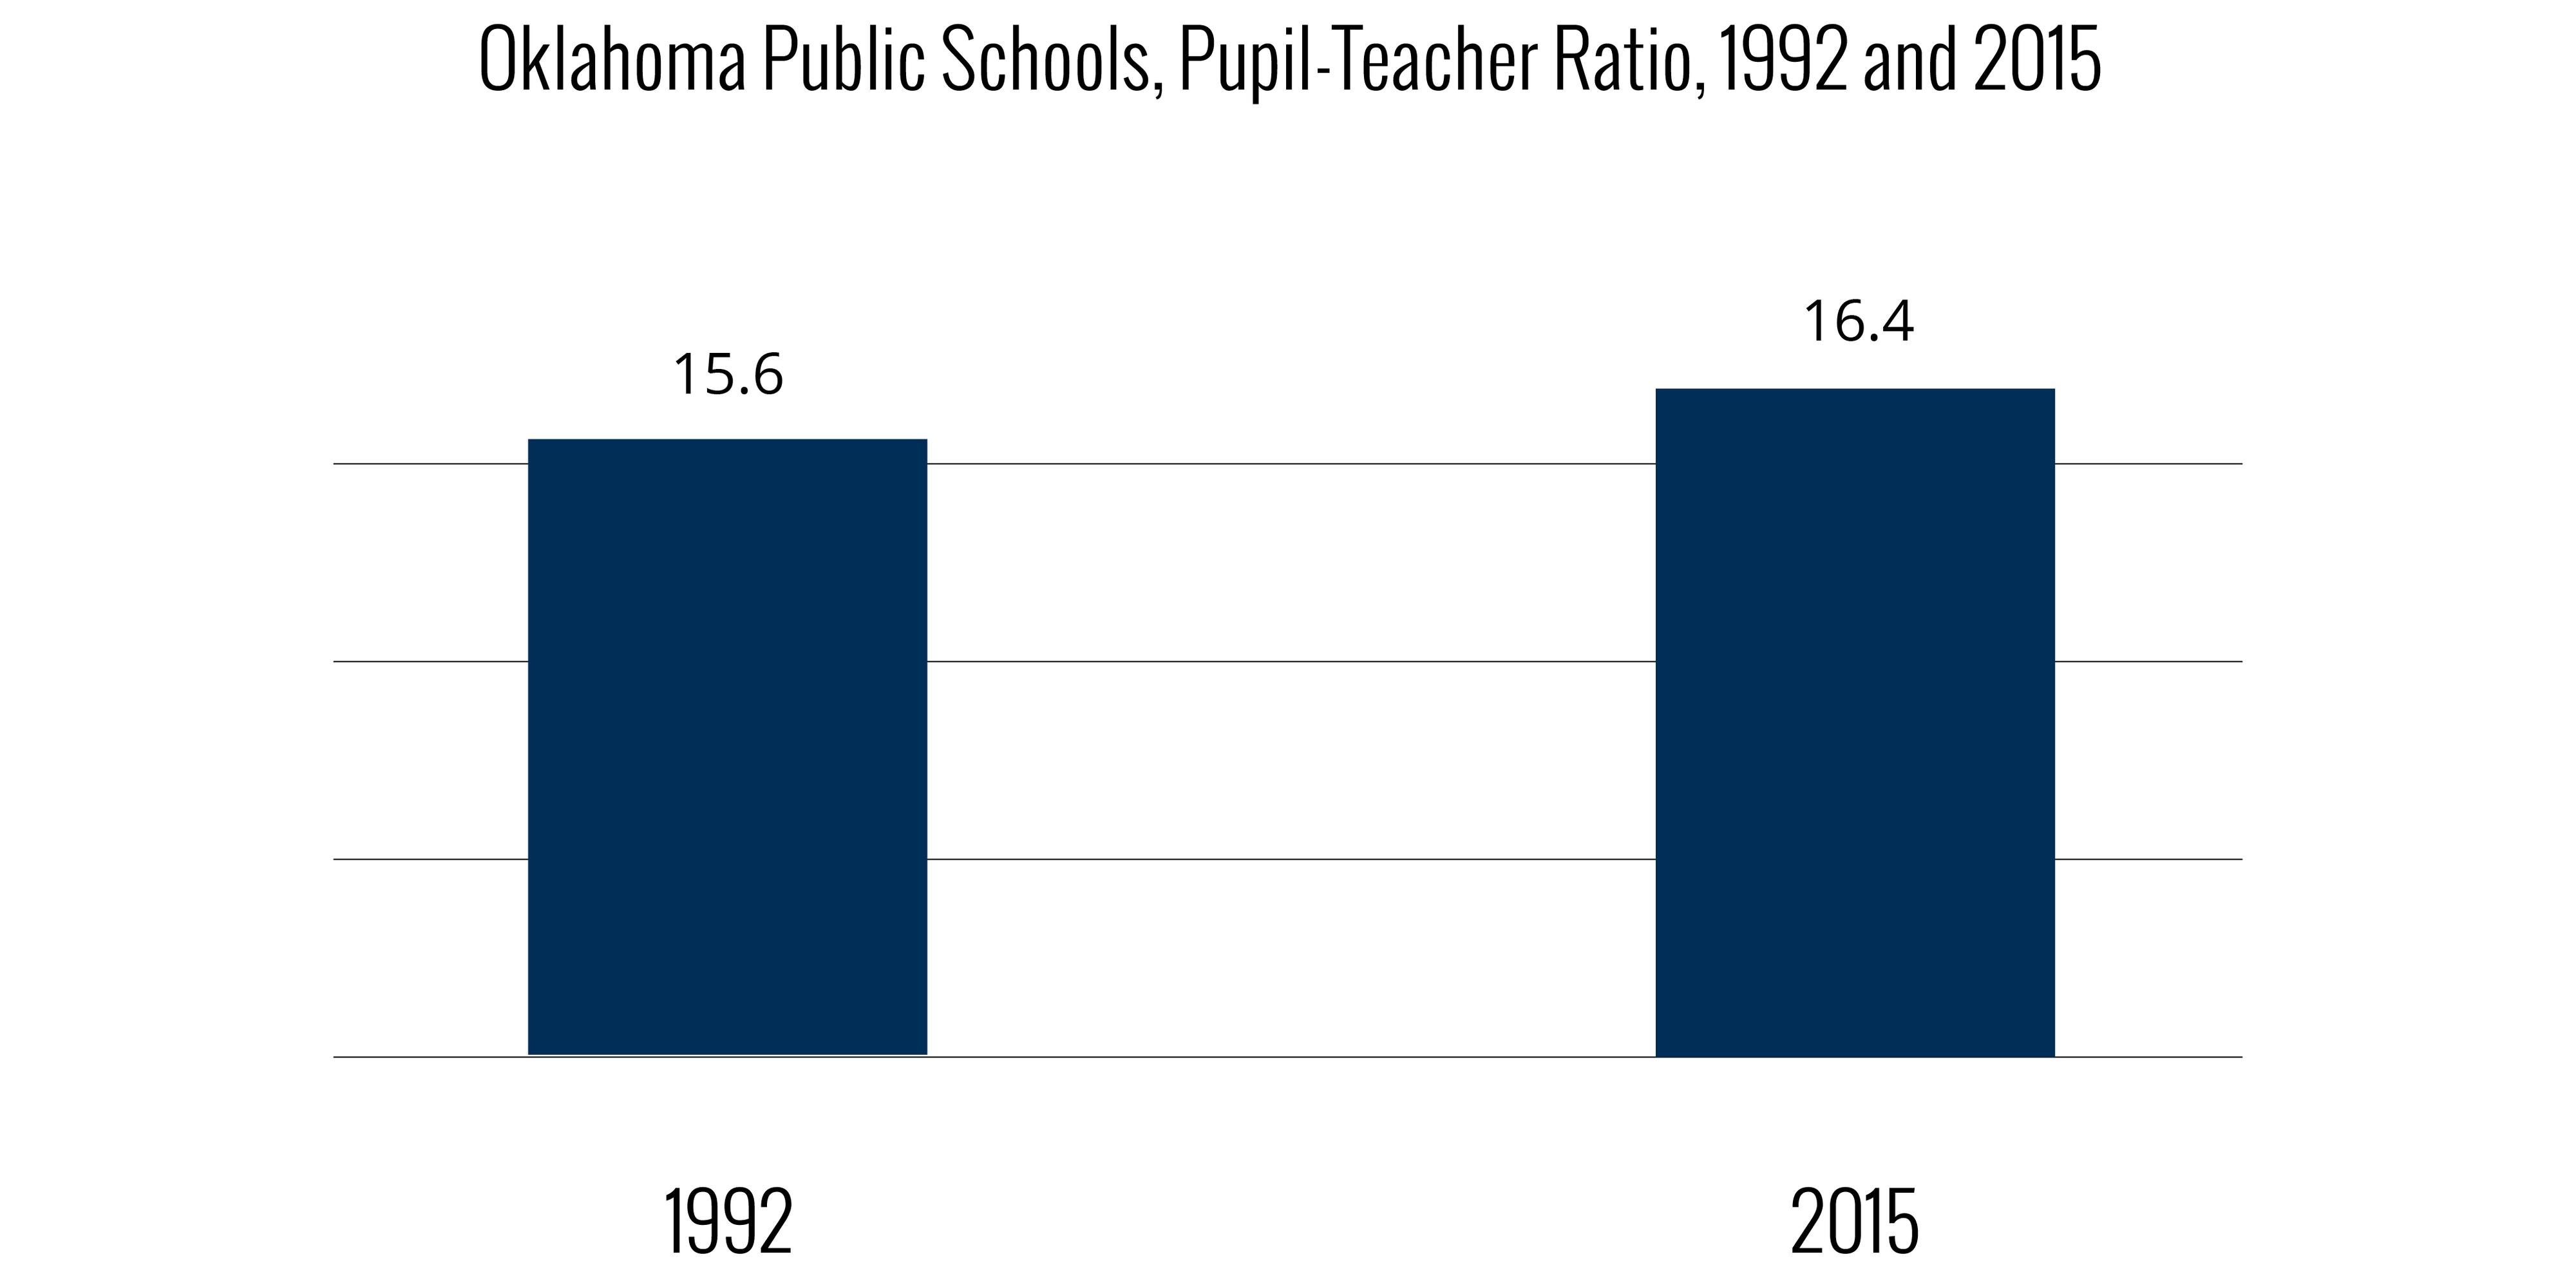
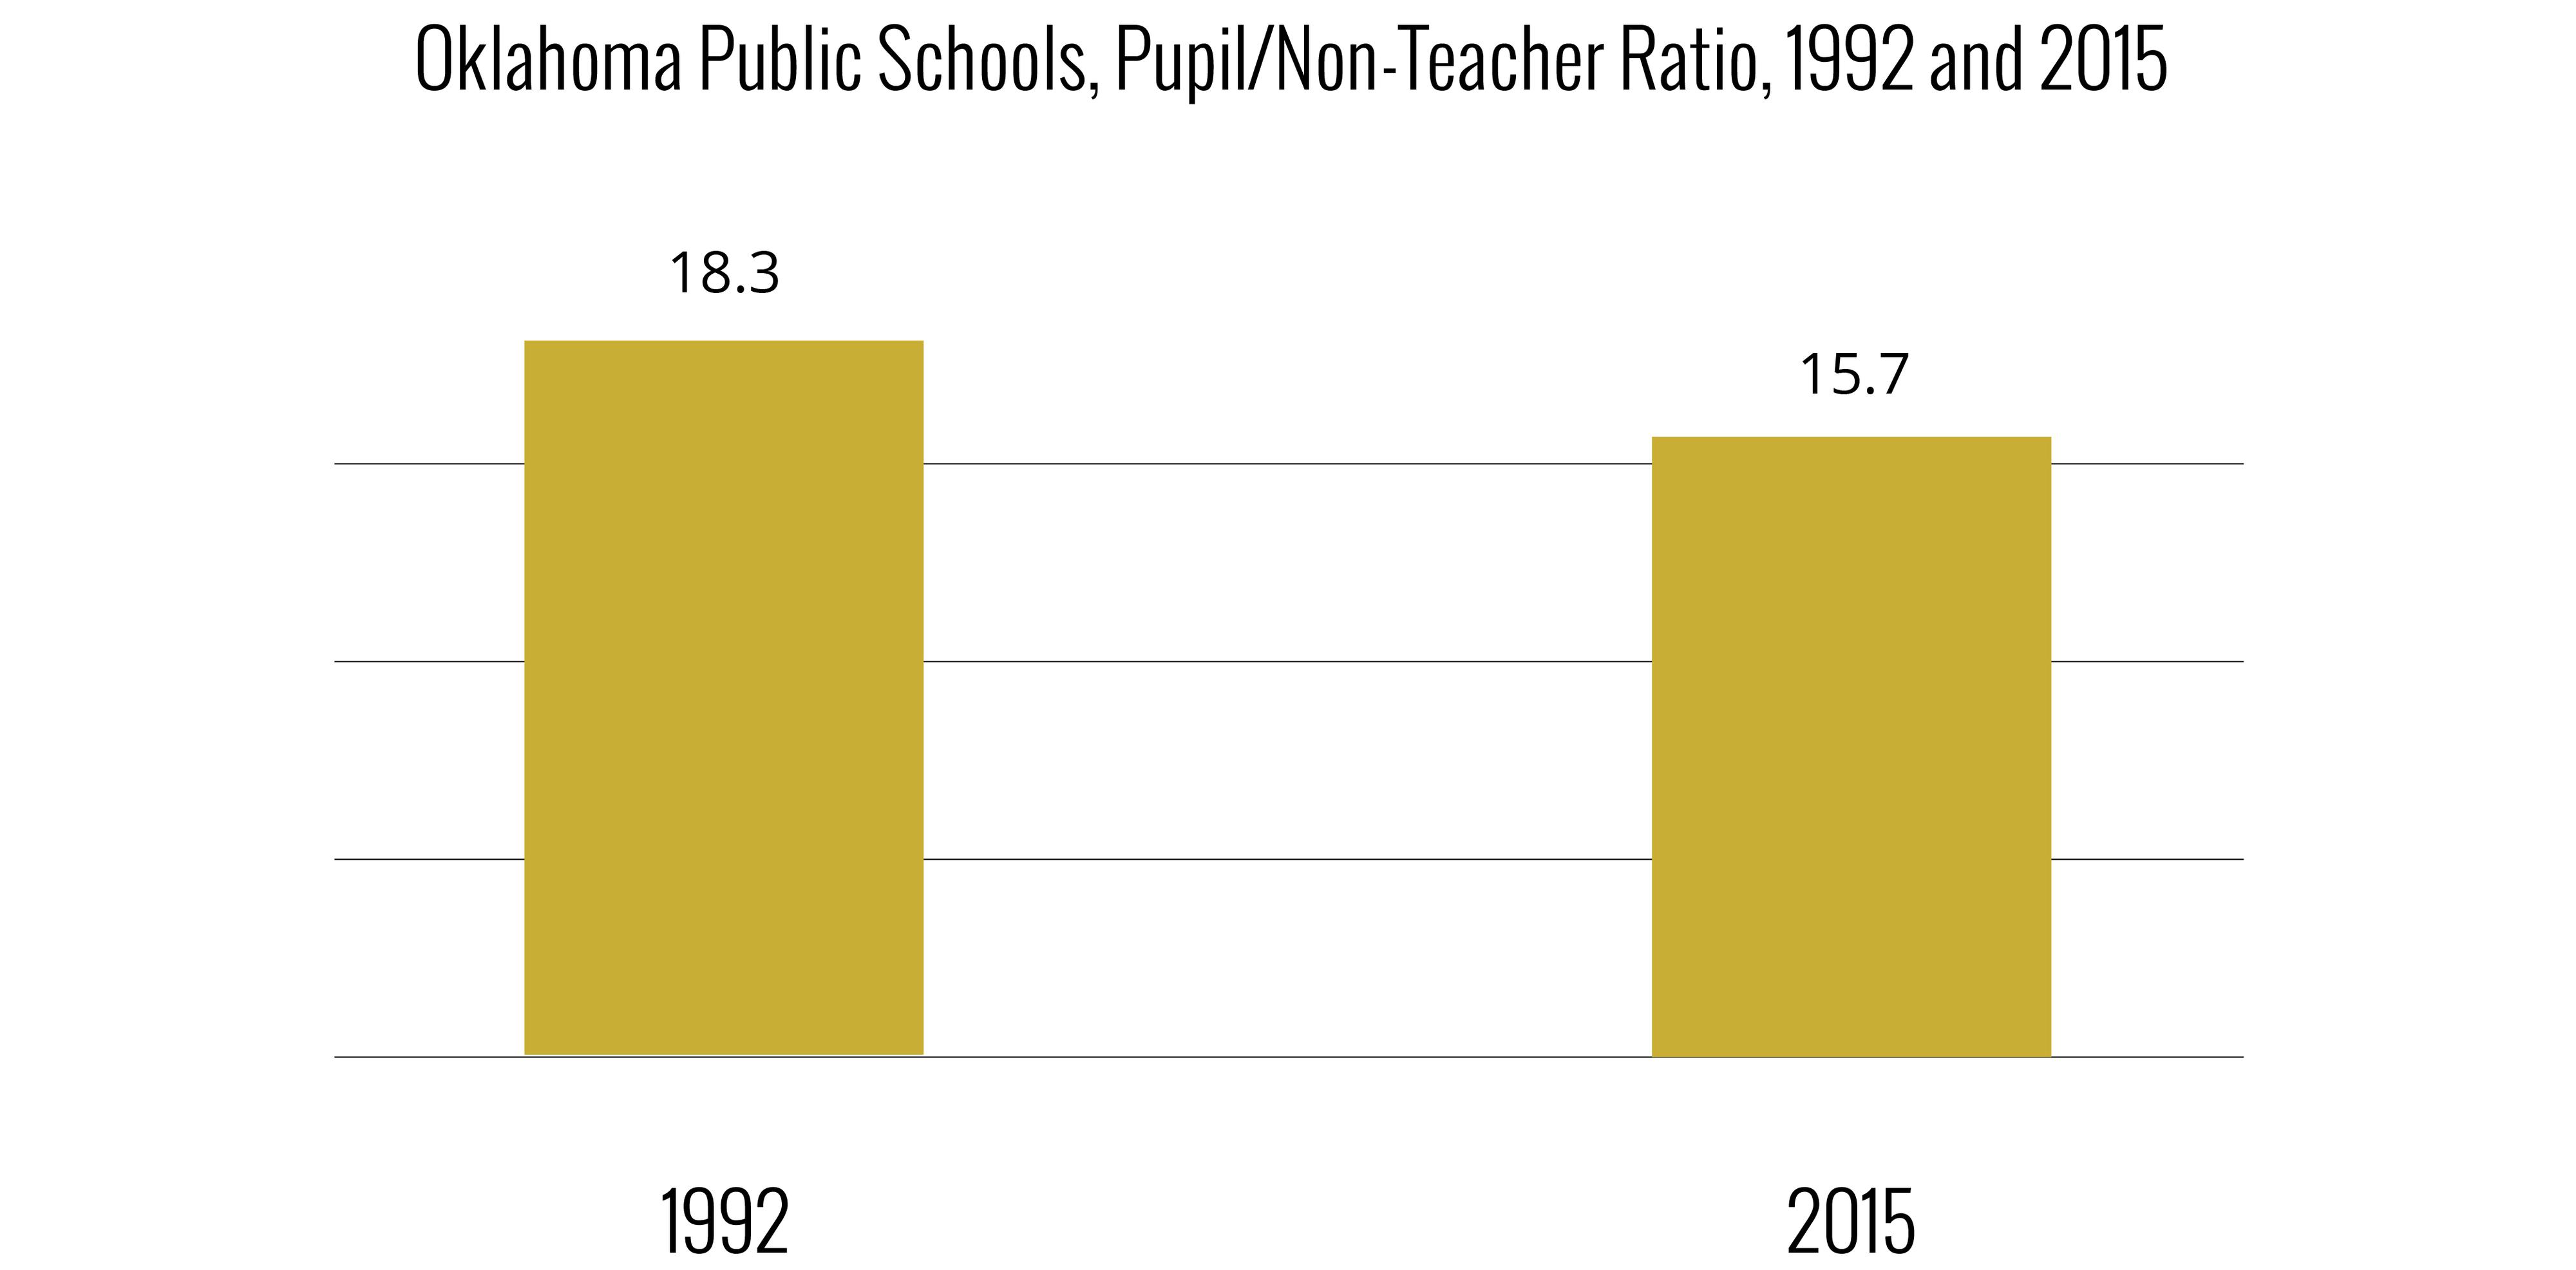
If schools receive more money, they are able to hire more teachers, hire more non-teachers, give pay increases, or use the funds on some combination of the three or for other items. Between 1992 and 2014, Oklahoma’s public schools did in fact receive more money: They increased their spending by 26 percent per student in real terms (adjusted for inflation). Yet over that same time period, average teacher salaries increased by only four percent—and class sizes got bigger. As the two charts below indicate, Oklahoma schools prioritized the hiring of non-teachers.2
To see the details for each school district, click here. To see the percentage of non-instructional spending in each school district, click here. The start and end dates in this article and in the hyperlinked tables are based on data availability and vary by chart and table, as noted. All data were reported by the Oklahoma State Department of Education to the U.S. Department of Education; any suspicions of data errors should be brought to the attention of the OSDE.
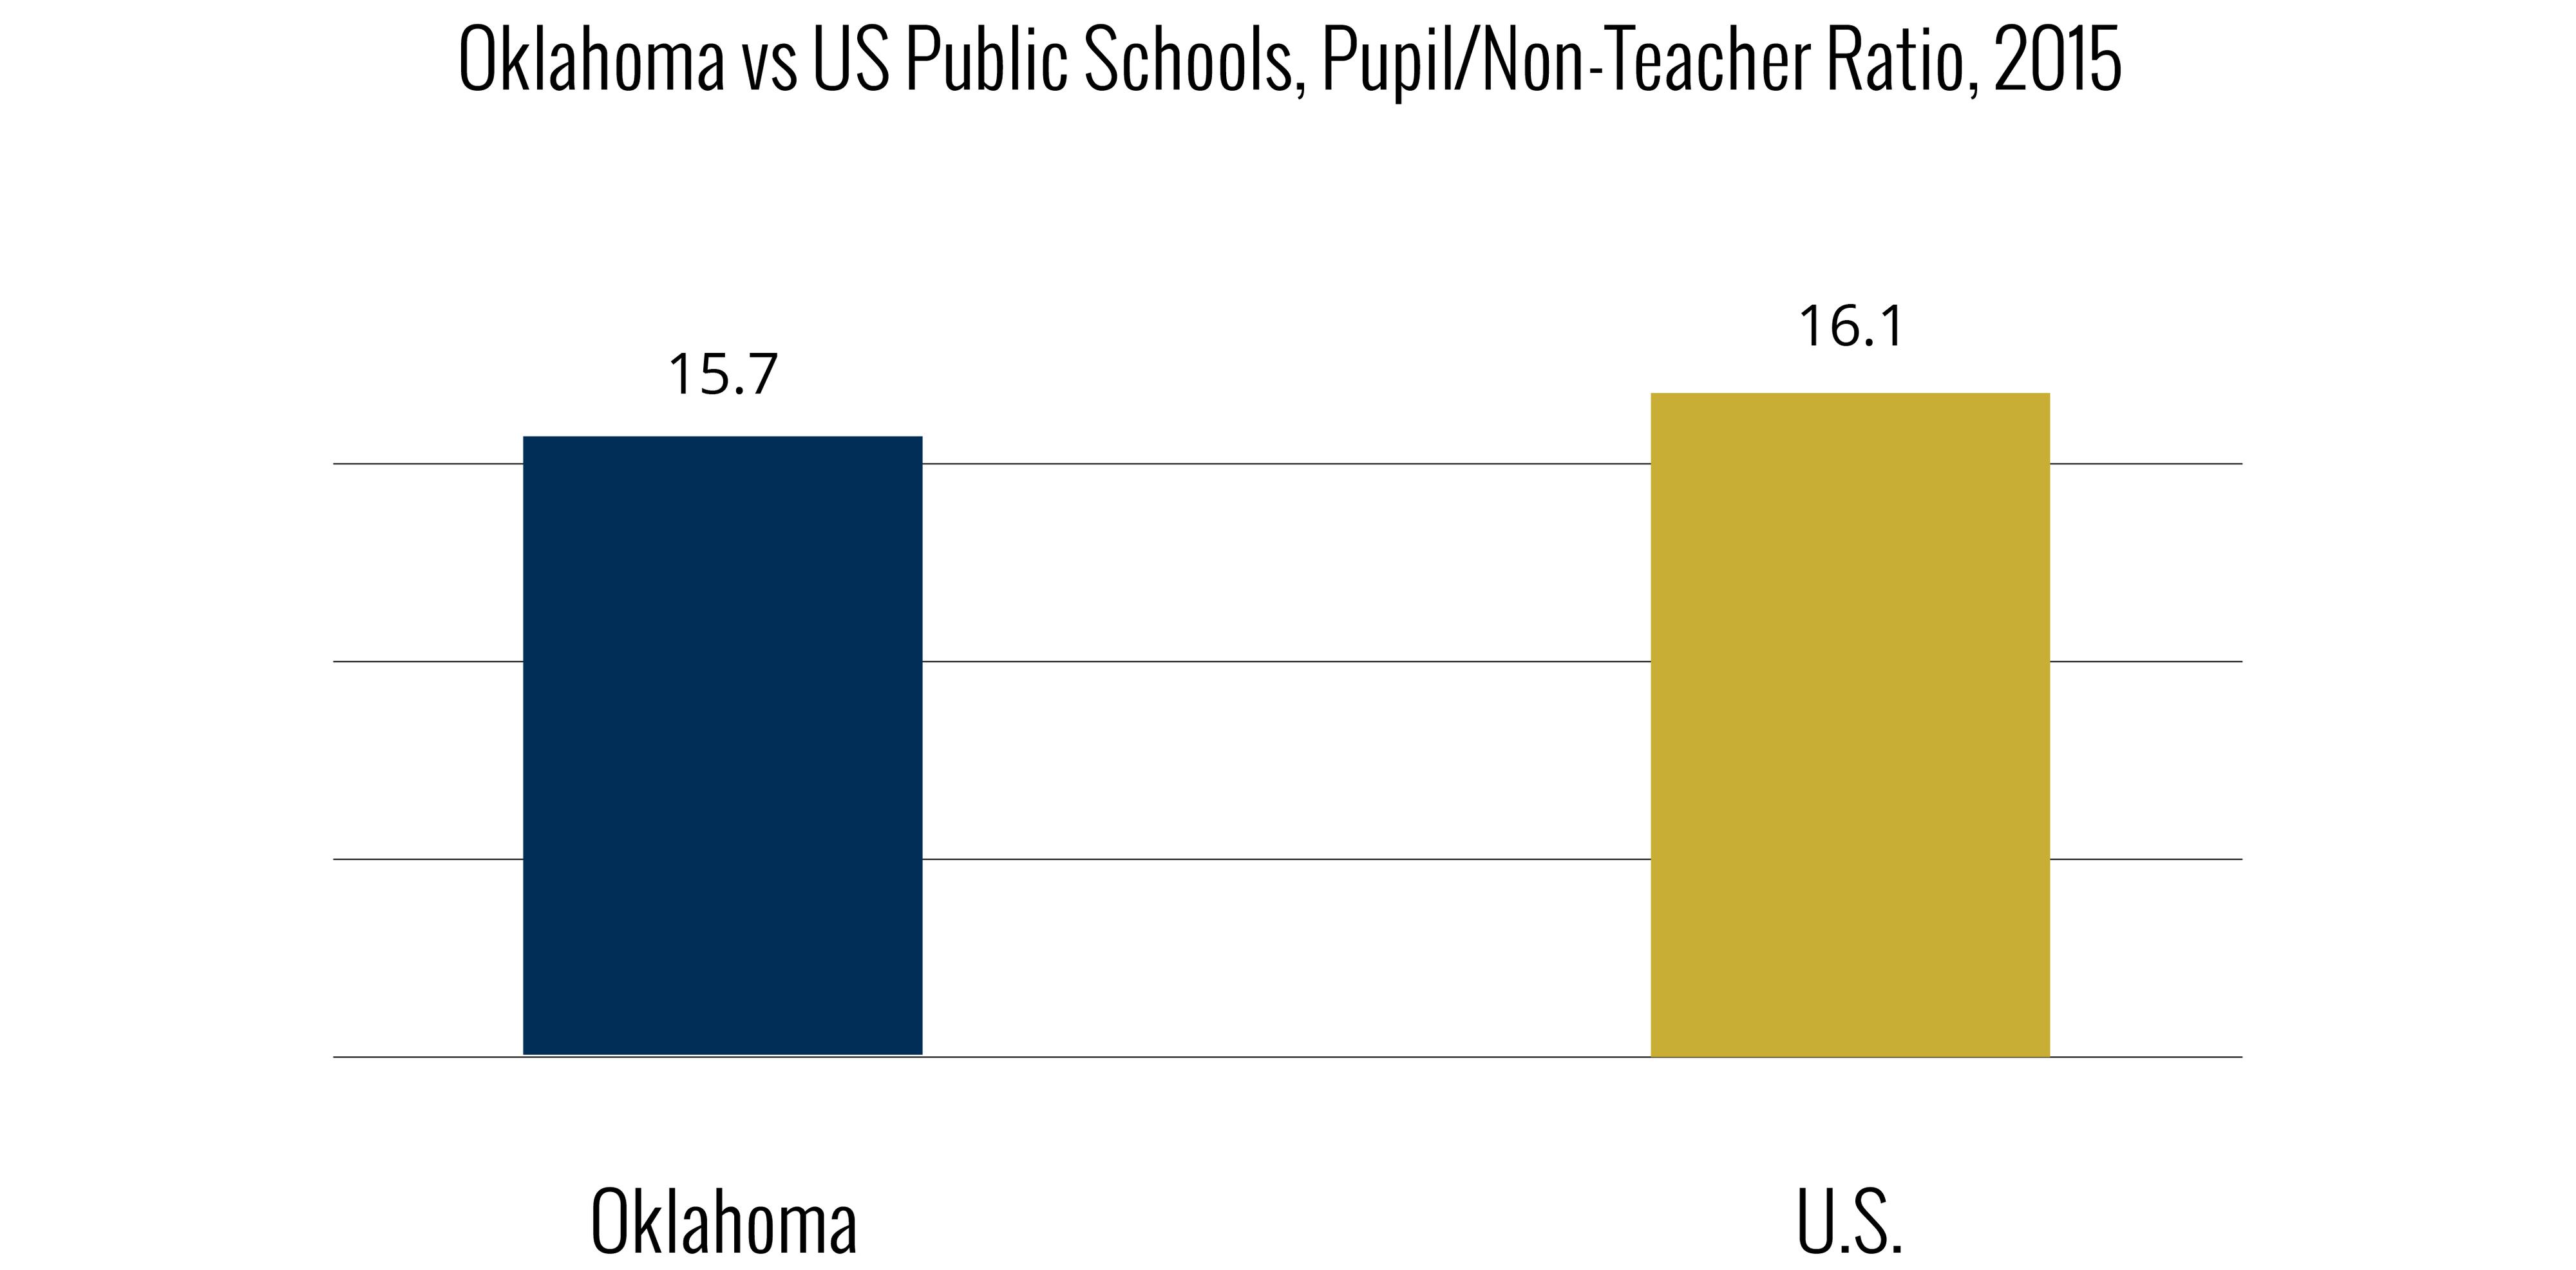
Today, Oklahoma’s public education system employs more non-teachers than teachers. Oklahoma public schools employed 43,762 non-teachers in 2015, while employing 42,073 teachers. As the chart below shows, Oklahoma public schools have more non-teachers than the national average.
Moreover, as the table below shows, Oklahoma’s percentage of non-instructional salaries and benefits is higher than the national average.
Non-Instructional Salaries and Benefits, FY 2014
| Oklahoma | U.S. | |
| Total salary | $3,156,928,522 | $318,721,009,410 |
| Total benefits | $1,006,518,974 | $123,647,457,808 |
| Instructional salary | $2,102,580,502 | $217,283,225,910 |
| Instructional benefits | $662,910,251 | $83,938,780,766 |
| Total salary + benefit | $4,163,447,496 | $442,368,467,218 |
| Instructional salary + benefit | $2,765,490,753 | $301,222,006,676 |
| Non-instructional salary + benefit | $1,397,956,743 | $141,146,460,542 |
| Percent non-instructional salaries + benefits | 33.6% | 31.9% |
Data are for the most recent year available, National Center for Education Statistics at the U.S. Department of Education, ElSi tableGenerator, https://nces.ed.gov/ccd/elsi/t...
The (Missing) $8,872 Teacher Pay Raise
What if Oklahoma’s 26 percent spending increase would have been devoted to teachers? If Oklahoma’s public schools would have maintained 1992 staffing ratios for non-teachers, that would have provided the public school system more than $373 million in annual recurring savings. That savings could have been spent on a permanent increase of $8,872 in annual teacher compensation.
Education officials sometimes argue that the increase in non-teachers can be blamed on a plethora of federal and state mandates. But if the increases in non-teachers were all due to federal and state mandates, then the pattern of increases and the levels present today would be similar across all school districts in Oklahoma. They are not. Nevertheless, these educators do have a point. Oklahoma schools are burdened with too many mandates (more than 600) at the state level alone; download the database of mandates here). Education officials must identify which ones are problematic and work to repeal them.
Oklahoma should consider freezing (or rolling back) pupil/non-teacher ratios and start giving priority to teachers.
1According to the U.S. Department of Education, a “teacher” is defined as “a professional school staff member who instructs students in prekindergarten, kindergarten, grades 1–12, or ungraded classes and maintains daily student attendance records.” Teacher aides and paraprofessionals are not considered teachers.
2Spending data come from National Center for Education Statistics, Common Core of Data (CCD), "State Nonfiscal Public Elementary/Secondary Education Survey," 2010-11 v.1a, 2011-12 v.1a and "State Nonfiscal Public Elementary/Secondary Education Survey Directory Data," 2014-15 v.1a, accessed February 24, 2017, retrieved via ElSi tableGenerator from https://nces.ed.gov/ccd/elsi/tableGenerator.aspx; National Center for Education Statistics, Table 236.75. Total and Current Expenditures Per Pupil in Fall Enrollment in Public Elementary and Secondary Schools, by Function and State or Jurisdiction: 2013-14 [web page], last modified July 2016, retrieved from https://nces.ed.gov/programs/digest/d16/tables/dt16_236.75.asp. Average teacher salaries come from National Center for Education Statistics (1995), Table 77. Estimated Average Annual Salary of Teachers in Public Elementary and Secondary Schools, by State: 1969-70 to 1994-95 [web page], last modified April 1995, retrieved from https://nces.ed.gov/programs/digest/d95/dtab077.asp; National Center for Education Statistics, Table 211.60. Estimated Average Annual Salary of Teachers in Public Elementary and Secondary Schools, by State: Selected Years, 1969–70 [web page], last modified September 2015, retrieved from https://nces.ed.gov/programs/digest/d15/tables/dt15_211.60.asp. The FY 1992 average teacher salary is inflation-adjusted by the January 1992 and January 2014 CPI-U, available from Bureau of Labor Statistics, CPI-All Urban Consumers, accessed February 24, 2017, retrieved from https://data.bls.gov/cgi-bin/surveymost?bls. Data on student enrollments and FTE staff come from Thomas D. Snyder and Charlene M. Hoffman (1994), Digest of Education Statistics 1994 (NCES No. 94–115), Table 42, p. 56, retrieved from https://nces.ed.gov/pubs94/94115.pdf; National Center for Education Statistics, Table 84. Staff and Teachers in Public Elementary and Secondary Schools, by State: Fall 1987 to Fall 1993 [web page], last modified April 1995, retrieved from https://nces.ed.gov/programs/digest/d95/dtab084.asp; National Center for Education Statistics, Table 203.45. Enrollment in Public Elementary and Secondary Schools, by Level, Grade, and State or Jurisdiction: Fall 2013 [web page], last modified August 2015, retrieved from https://nces.ed.gov/programs/digest/d16/tables/dt16_203.45.asp; National Center for Education Statistics, Table 213.20. Staff Employed in Public Elementary and Secondary School Systems, by Type of Assignment and State or Jurisdiction: Fall 2013 [web page], last modified August 2014, retrieved from https://nces.ed.gov/programs/digest/d15/tables/dt15_213.20.asp.